
Commercial and industrial solar portfolios quietly lose revenue to dust. In arid regions, that loss compounds fast: every day that particles settle on glass, your Soiling Ratio drifts, your production forecast slips, and the gap between modeled and actual revenue widens. The fix isn’t one‑off heroics; it’s consistent, high‑frequency cleaning designed around measured soiling, safe methods, and tight operations.
This guide is written for facility managers, EPCs, and asset leaders who need an executive‑level view of options, risks, and total cost of ownership. The through‑line is simple: if your sites see sustained dust, automated and often waterless cleaning—scheduled or triggered by measured thresholds—can protect annual yield and stabilize cash flows. Let’s set the frame and then get specific.
Why automated, high‑frequency cleaning matters
Soiling is the gradual accumulation of dust, pollen, salt, and other particulates on module glass. Two linked metrics help you quantify it. Soiling Ratio (SR) is commonly used in O&M analytics as the ratio of soiled to expected clean performance; Soiling Loss (SL) is 1 − SR. These terms are used in international guidance for PV performance tracking. According to the discussion in the 2024 IEA PVPS Task 13 KPI report, SR/SL inform operational KPIs and decisions and align with the IEC 61724 monitoring family; the report also notes practical considerations when deploying sensors and interpreting data. See the full report here: the IEA PVPS Task 13 Technical and Economic KPIs (2024).
What matters for executives is the economic shape of soiling. In dusty climates, losses can ramp between rains and remain high if unmitigated. Analyses compiled by IEA PVPS show that moving from fixed‑interval to condition‑based cleaning—triggered at a defined soiling‑loss threshold—often improves net revenue in arid sites because you catch the inflection before revenue erosion compounds over weeks. Their 2021 risk quantification report frames this as an optimization problem: pick the trigger that balances cleaning cost against recovered energy under your tariff, outage, and labor constraints. See IEA PVPS Task 13 Quantification of Technical Risks in PV Power Systems (2021) for context.
For further background on definitions and monitoring practices, IEA PVPS O&M guidelines (2022) summarize IEC 61724‑style approaches to measuring performance and soiling in real plants, with notes on sensor placement and maintenance windows.
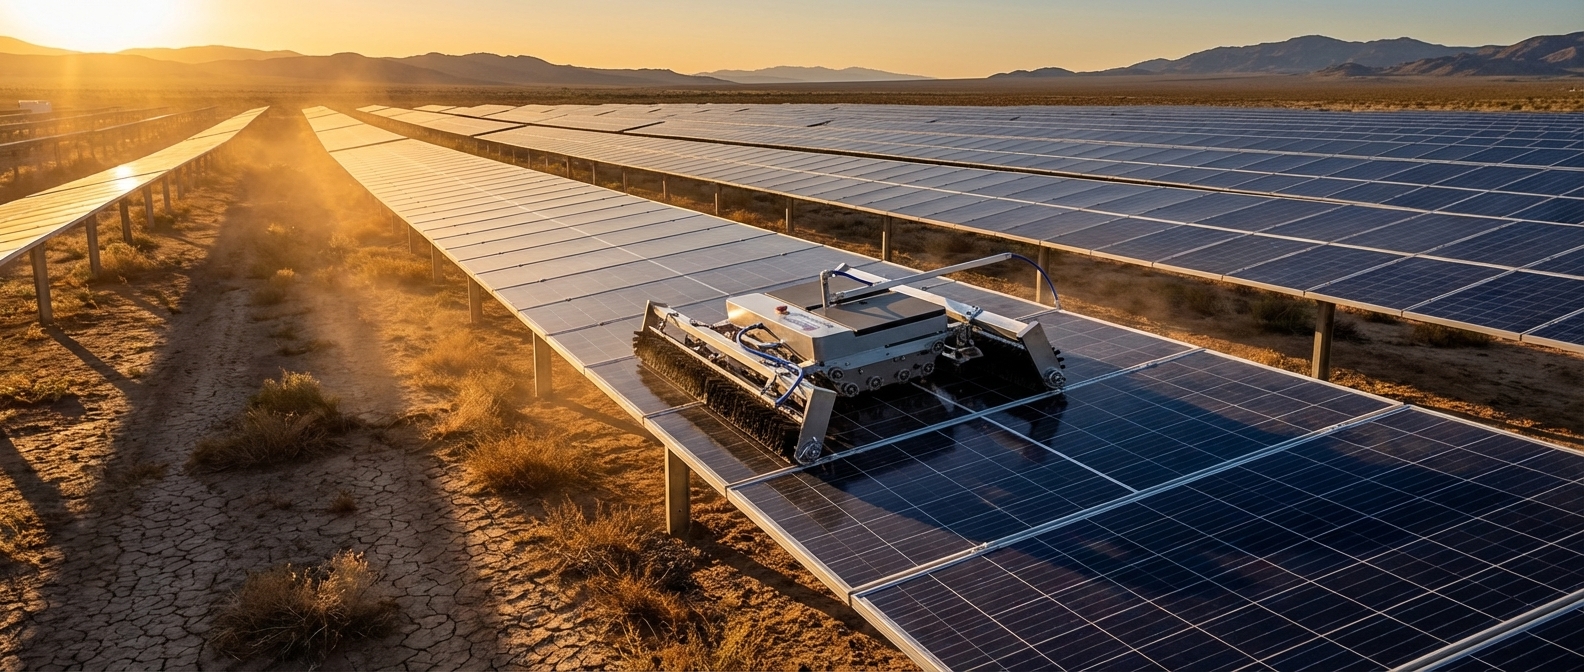
The operational implication: high‑frequency, sometimes daily or near‑daily in peak dust seasons, can be justified when a robot’s marginal run cost is low and downtime is minimal. That’s where autonomy and waterless methods can change the calculus.
Technology landscape and fit
Cleaning modes. Dry or waterless brushing uses soft bristles to remove dust without water and is favored where water is scarce or where frequent passes are required; abrasion risk is managed by brush material and pressure calibration. Wet cleaning with deionized water is effective on sticky contaminants but requires water quality control and careful runoff management. Hybrid approaches combine a light pre‑rinse to lift gritty dust with gentle brushing when purely dry methods could risk micro‑abrasion.
Mobility formats. Rail‑mounted units operate on fixed tracks along rows and can achieve high linear throughput on uniform arrays—trade press has profiled products in this category with notable cleaning speeds, though any number is site‑dependent and must be verified during trials. Crawler or portable robots traverse modules or frames and suit varied geometries while redeploying across sites. Lightweight rooftop cleaners address C&I rooftops and carports where access, parapets, and weight limits matter.
If you’re evaluating lightweight, portable options for rooftops or smaller ground‑mount blocks, a practical example is a lightweight portable solar panel cleaning robot for dry, waterless cleaning. Use it as a reference point for form factor and operating mode—then validate fit, cleaning forces, and warranty alignment through a controlled pilot.
Compatibility considerations include module frame heights, tilt angles, inter‑row spacing, and tracker versus fixed‑tilt geometry.
Tracker applications require special attention. Ensure the robot’s operating envelope matches row rotations and stow positions; some vendors publish tracker‑specific models and catalogs describing suitability and constraints. When exploring what dry, waterless formats look like in practice on rooftops, you can review example product pages from MULTIFIT to visualize rotating‑brush designs in the market. Treat any specifications as illustrative until validated during procurement.
Standards, safety, and warranty guardrails
Standards alignment gives your team common language and reduces ambiguity in performance tracking and acceptance. Two anchors are particularly useful. First, the KPI and O&M guidance from IEA PVPS Task 13—specifically the Technical and Economic KPIs report (2024) and the O&M Guidelines (2022)—describe how Soiling Ratio is used in practice and reference the IEC 61724 monitoring family, including notes on measurement windows and sensor maintenance.
Second, capacity testing practices summarized in a 2024 paper explain how ASTM E2848 PV capacity evaluation typically treats soiling as an agreed project loss while regression focuses on irradiance, temperature, and wind. That distinction matters when you benchmark acceptance expectations for cleaned versus soiled states.
Safety isn’t optional. For rooftop and ground operations, follow OSHA’s solar electrical hazard guidance, establish lockout/tagout procedures where needed, and ensure fall protection and emergency stops are in place. When planning access routes, guardrails, and anchors, the NIOSH Prevention through Design toolkit (2024) is a practical reference. Schedule cleaning in cooler, low‑irradiance windows to reduce thermal shock and site conflicts.
On warranties, avoid blanket statements. Module OEMs specify cleaning instructions—water quality (often deionized), approved brush materials, maximum pressure, and no‑chemical policies. Secure written alignment with these instructions before authorizing any robotic method. Periodically audit for abrasion or coating damage, especially in early deployments.
TCO and ROI framework for decision‑makers
A robot only makes sense if recovered energy revenue and operational risk reduction outweigh capex or lease plus run costs. Build a simple model around revenue variables (baseline soiling trajectory SR/SL, energy tariff or PPA, irradiance seasonality, and your cleaning triggers) and cost variables (labor, water if used, robot capex or lease, maintenance and spares, mobilization, and any opportunity cost from downtime or night operations). Evaluate payback and NPV/IRR over 10–15 years, then run sensitivities on soiling rate, tariff, and cleaning frequency.
Public O&M literature still provides useful anchors. NREL’s Best Practices for PV O&M documents cleaning activity observations of roughly $0.25/m² for large systems to $1/m² for small systems (2018 context). Treat these as historic anchors and adjust for 2026 labor and water costs in your geography. Robot capex and maintenance vary by vendor and site; request itemized quotes and run scenarios. If you’re comparing capital purchase to a service model, include the vendor’s availability commitments and MTTR in your risk‑adjusted cash flows.
Below is a simple scenario table to show how frequency interacts with dust severity when solar panel cleaning robots enable quick, mostly waterless passes. The numbers are illustrative placeholders for planning; replace with your site’s SR measurements, tariff, and quotes.
|
Scenario |
Dust severity |
Trigger policy |
Estimated annual energy recovered |
Indicative payback band |
|---|---|---|---|---|
|
A |
Mild (slow SR drift) |
Clean when SL reaches ~2–3% |
1–3% uplift vs quarterly manual |
3–6 years |
|
B |
Moderate |
Clean when SL reaches ~4–5% |
3–6% uplift vs monthly manual |
2–4 years |
|
C |
Heavy (arid, high dust) |
Daily/near‑daily in peak season |
6–12% uplift vs periodic manual |
1–3 years |
Assumptions: high uptime windows with minimal outage, low marginal run cost per pass (waterless), and tariffs where recovered kWh are materially valuable. Sensitivity: if tariffs are low or dust is seasonal and brief, optimal frequency and payback shift. When possible, ground your model with SR/SL from on‑site soiling stations or analytics aligned with the IEA PVPS and IEC 61724 practices cited above.
Procurement and deployment playbook
The fastest way to de‑risk selection is to run a structured trial on a representative block. Before RFP, survey geometry (frame height, tilt, inter‑row gaps), rooftop parapets and anchors, tracker motion envelopes, obstructions, access routes, and safe staging areas. Baselining SR/SL with temporary soiling measurement or monitoring‑platform analytics will help you design meaningful trigger thresholds.
In negotiations, ask vendors to document cleaning mode and brush materials, pressure control and calibration procedure, water quality specs if wet or hybrid, cleaning speed and daily capacity, autonomy level and scheduling options, SCADA or EMS integration paths and protocols, safety features (emergency stop, edge detection), maintenance plan and expected brush wear, training and support, and their warranty coordination process with module OEMs. Price both capex and lease if available, and insist on a pilot with alternating cleaned versus control rows to validate energy uplift.
Pilot commissioning should include operator training, defined cleaning windows (e.g., night or early morning), alarm and audit‑log verification, and a two‑to‑four week measurement campaign. At the end, review glass and coating under magnification for abrasion, and decide your trigger policy for each site.
Operational integration in dusty regions with solar panel cleaning robots
Turn measurement into action. Use SR/SL tracking to convert calendar plans into triggers by site and season. In spring pollen or during construction nearby, raise frequency. In calmer months, relax it. Align passes with low‑impact windows and ensure crews can respond to alerts.
On tracker sites, verify that your chosen robot can operate safely at relevant tilt angles and stow positions, and that inter‑row transfers are feasible. Some tracker‑oriented models publish catalogs with geometry limits and operating envelopes; consult those documents during design. For a tracker‑compatibility example, review the MR‑T1 tracking robot catalog excerpt from MULTIFIT as an orientation aid; validate all details in trials.
For seasonal context on why cadence matters, practitioner articles can help operations teams plan staffing and inspection cycles. See, for example, this short discussion of why to clean solar panels regularly for additional reading.
Case example: 48 MW ground‑mount plant in Qatar (anonymized)
The numbers below are provided as a real‑world planning example from a 48 MW ground‑mount site in Qatar and should be treated as site‑specific (not universal). The purpose is to show how a measured, threshold‑based approach can translate into an operating cadence.
-
Site context: arid climate; windblown dust events.
-
Baseline soiling: estimated 15–25% production loss during dusty periods without timely cleaning.
-
Trigger policy: initiate cleaning when soiling loss (SL) reaches ~3%.
-
Cadence: daily during concentrated wind/sand periods; weekly in the off‑season.
-
Observed impact: approximately 35% production improvement reported after implementing the chosen cleaning strategy.
-
Cost basis: cleaning machine purchased (CAPEX model).
Notes for readers: treat “baseline loss” and “observed improvement” as metrics that must be verified with your own SR/SL instrumentation and plant revenue model. Results depend on module type, array geometry, wind patterns, and how “improvement” is defined (e.g., instantaneous recovery after cleaning vs. annualized net gain).
Alternatives and when robots aren’t the answer
There are credible cases where manual or semi‑automated cleaning is the right call. Small arrays with easy access, low dust, and low tariffs may not justify robotic capex. Semi‑automatic pole systems with deionized water remain effective for sticky contaminants on compact sites. Fixed rail‑mounted cleaners can make sense where geometry is uniform and permanent infrastructure is acceptable. Hydrophobic coatings can reduce adhesion but need careful warranty review and performance verification; treat them as a complement, not a substitute for cleaning in dusty regions.
Use a simple decision filter: if your measured SR rarely drops below a 2–3% loss between natural cleaning events (rains) and your tariff is modest, schedule periodic manual cleaning and revisit annually. If SR declines quickly and repeatedly, or if night operations are preferred for safety and uptime, a robot—especially a waterless design—often improves net revenue and reduces risk exposure. That’s the core business case for waterless solar panel cleaning in high‑dust environments.
Executive decision flow
-
Establish SR/SL measurement and baseline per site.
-
Model TCO with your tariffs, labor or water costs, and downtime policies.
-
Shortlist robot formats that fit geometry and safety constraints; run a controlled trial.
-
Confirm warranty alignment with module OEMs; document brush materials, pressure, and water specs.
-
Set trigger thresholds and seasonal adjustments; integrate alarms with monitoring or SCADA.
-
Scale with a spare‑parts plan, operator training, and periodic QA for abrasion and yield.
If your sites experience sustained dust and frequent SR drops, a short pilot with autonomous solar panel cleaning robots—ideally waterless—will quickly show whether high‑frequency passes can lock in annual yield and stabilize cash flows.
About this guide
This article is written by the MULTIFIT team, drawing on PV system engineering and O&M experience in dusty and water‑constrained environments. MULTIFIT (founded in 2009) develops renewable‑energy electrical products and related PV cleaning equipment and operates under a quality and environmental management framework (including ISO 9001 and ISO 14000 family certifications, as applicable to scope).
This is an informational guide, not a substitute for site‑specific engineering, EHS procedures, or module OEM cleaning instructions. Always validate robot compatibility, cleaning forces/materials, and performance assumptions through a controlled pilot and written OEM alignment.
Version and sources
-
Last updated: 2026-03-23
-
Core public references used in this guide:
-
IEA PVPS Task 13 — Technical and Economic KPIs (2024)
-
IEA PVPS Task 13 — O&M Guidelines (2022)
-
IEA PVPS Task 13 — Quantification of Technical Risks in PV Power Systems (2021)
-
ASTM E2848 discussion summary (2024)
-
NREL — Best Practices for Operation and Maintenance of Photovoltaic and Energy Storage Systems (2018)
-
OSHA and NIOSH safety guidance for solar and rooftop work
-
Any scenario numbers in tables are illustrative unless explicitly labeled as site data. External links are provided for reader verification and may change over time.
Post time: Mar-23-2026